By Abdussalam Amoo
Journalists have been urged to implement data visualisation to improve the quality of their stories.
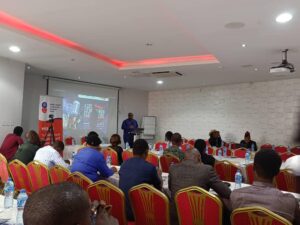
The facilitator of the monthly Hacks/Hackers Meetup for Journalists in Lagos, Mr John Eromosele gave the advice at the June meeting with the theme “Charting – Enrich your story”.
Eromosele noted that telling a story using data gives it more credibility and makes the audience to understand better.
He differentiated infographics from visualisation in terms of how the former is a pictorial representation of data while the latter is an informational representation of infographics.
He said data visualisation is more interactive than infographics, which is mainly static.
With data visualisation, he explained that the readers get a clearer picture of the news stories as such integrates more than just graphs, charts and figures.
A visualised data could integrate more so that readers are able to choose what to see and even have access to the raw data being visualised.
This can be implemented across all medium by the journalists irrespective of whether they are in the print, broadcast, online or multimedia platforms.

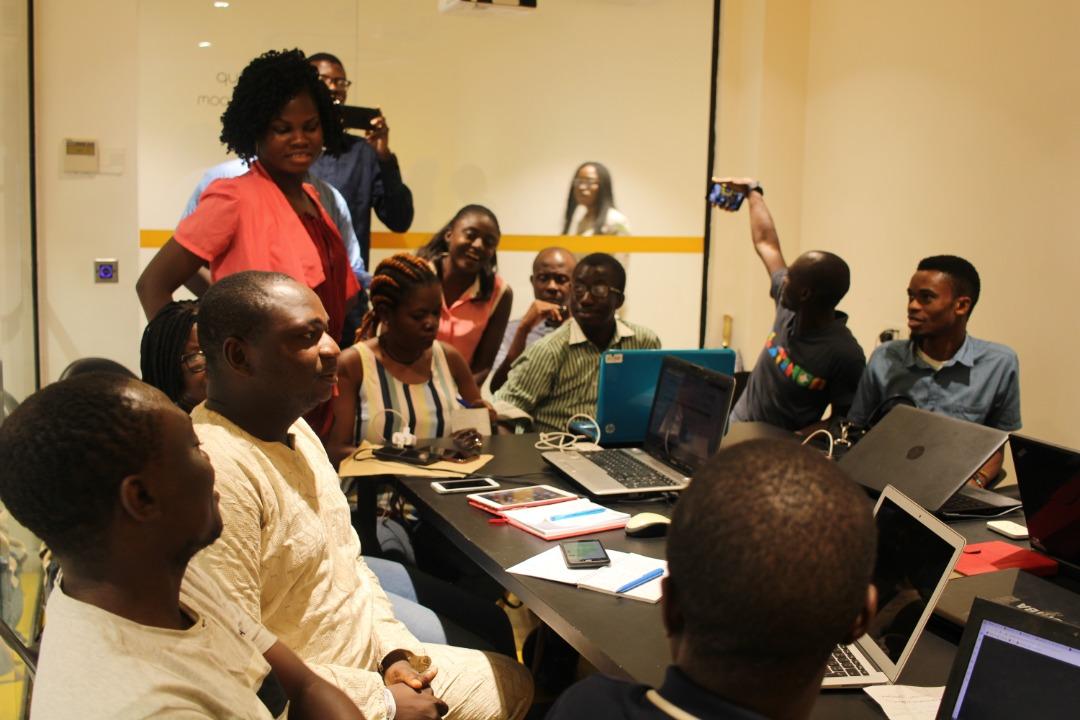
Journalists at the training were taken through the use of web-based application Infogram (infogram.com) to ensure that they are able to implement data visualisation in their stories.
The Hacks/Hackers Meetup holds monthly in various cities in Africa and is facilitated by CodeforAfrica, an organisation that trains journalists on Data Journalism.
Attendance is free for all interested journalists but interested persons have to register via http://bit.ly/CodeForAfrica. In Nigeria, the training currently runs in Abuja, Benin and Lagos.